Deciphering Value and Growth Investing
April 11, 2024
Blog Image


Key Highlights

  • Value and growth investing tends to rotate in cycles, and many seem to have studied them superficially.

  • Value-growth investing should stretch well beyond mathematical and statistical models, as qualitative factors also can influence investment outcomes.

  • Macroeconomic conditions affect value and growth sectors and companies differently.

  • Government regulations and policies can greatly affect sector fundamentals.

  • The evolution between active and passive investing also influences style and factor trends.


U.S. Value-Growth Background

While growth stocks have handily outpaced value stocks over the past decade, there were periods when the latter outperformed the former by a good stretch. In fact, multiple studies show value investing may be the preferred method over a long-term period. For example, the Fama-French three-factor model is a statistical model designed by renowned Nobel laureates, Eugene Fama and Kenneth French. The model found that value stocks outperform growth stocks over the long term, and it has long been part of the framework behind portfolio management and asset pricing.

But despite the academic research, we still experience periods when growth stocks greatly outperform value stocks. We typically see this occur when innovative technologies generate excitement, including the dotcom boom period and perhaps the current one driven by artificial intelligence (AI).

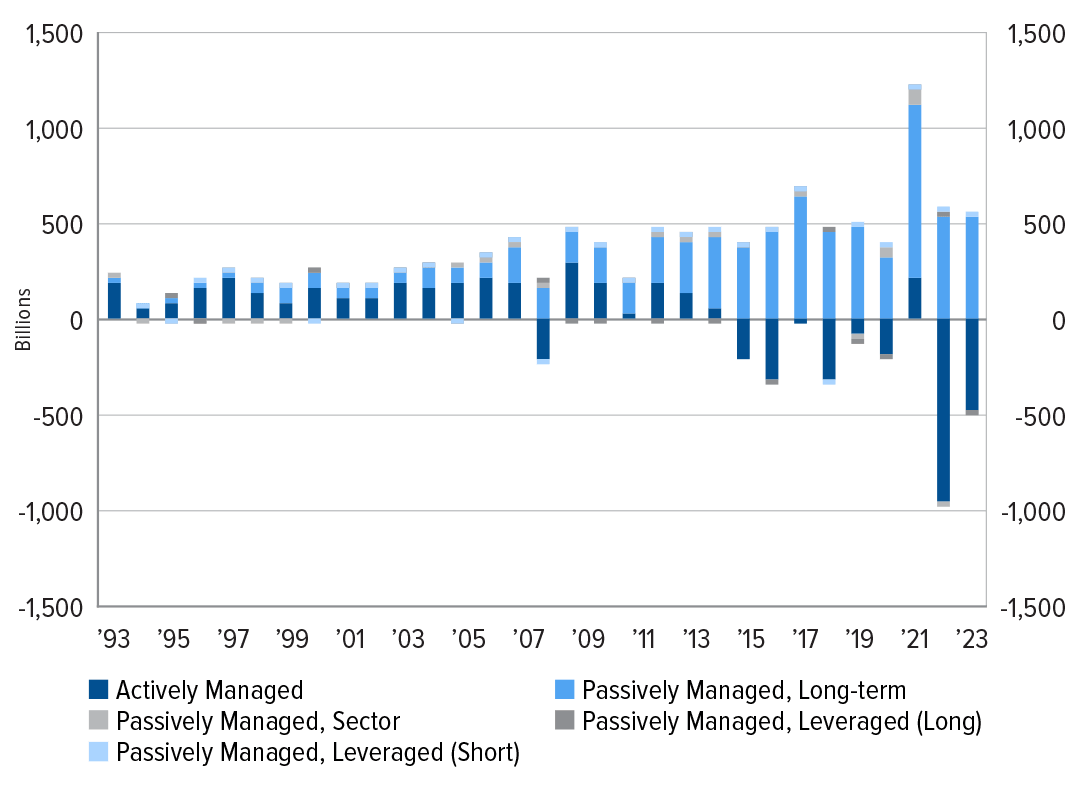
Though academic research is important, real-life portfolio management stretches well beyond the three factors typically measured (i.e., size, valuation, and overall market risk). For instance, regulatory environments can drive or hinder sectors. Furthermore, with the tremendous growth in passive investing, there has been a great shift of influence toward index providers such as Standard and Poor’s (S&P) and its prominent S&P 500® Index.


Performance—Value vs. Growth

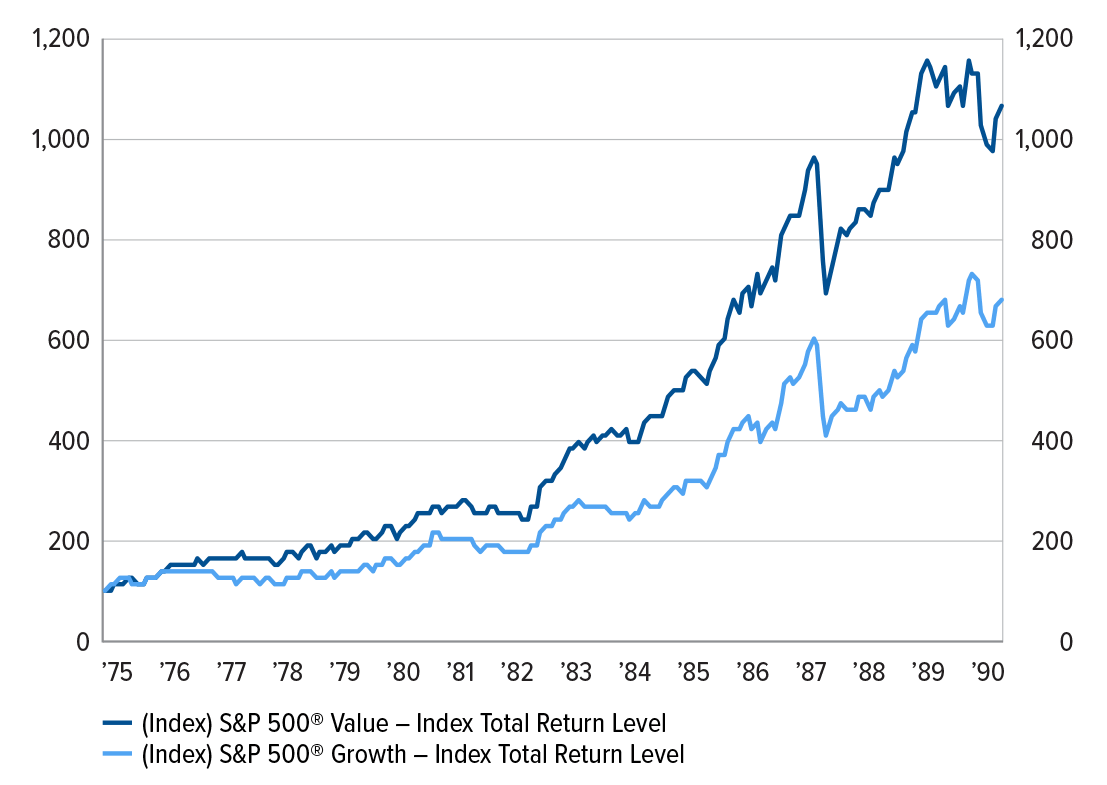
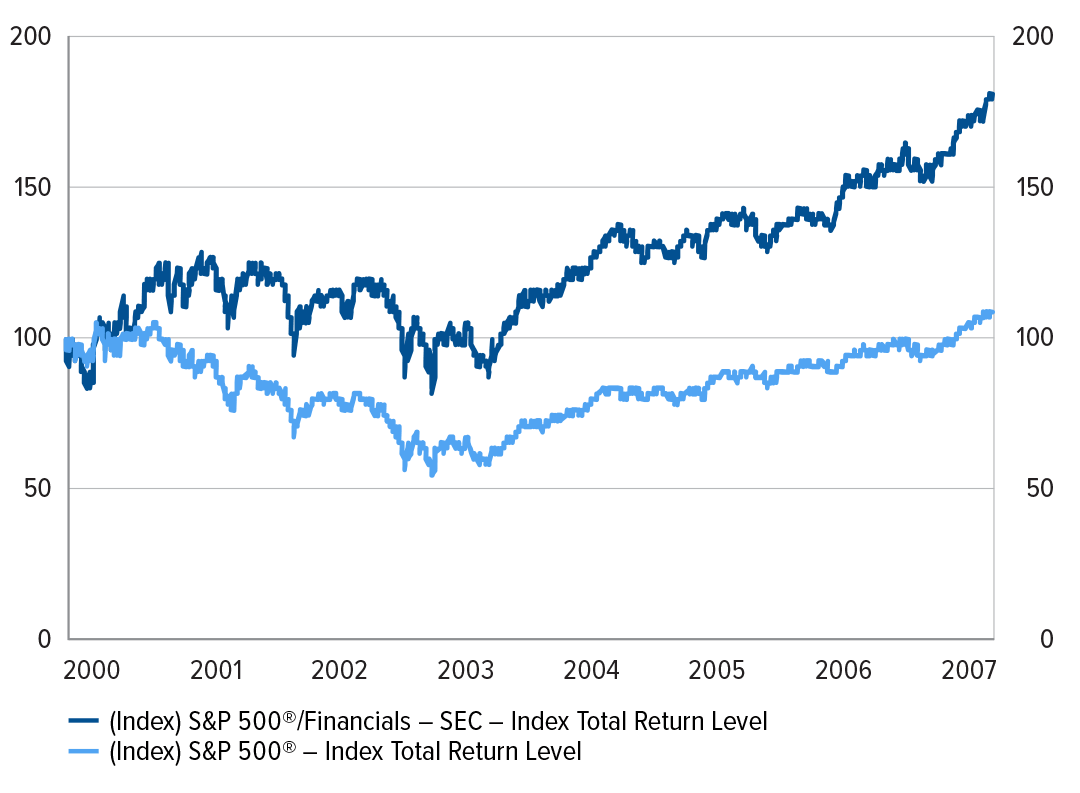
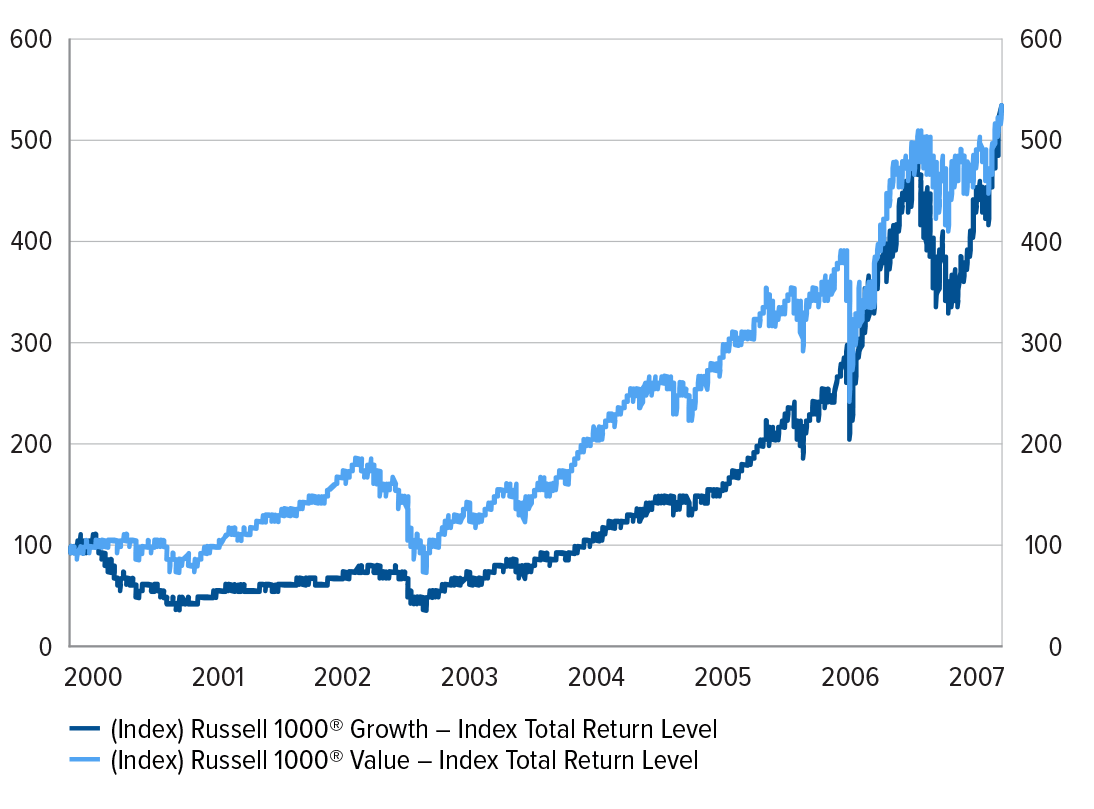
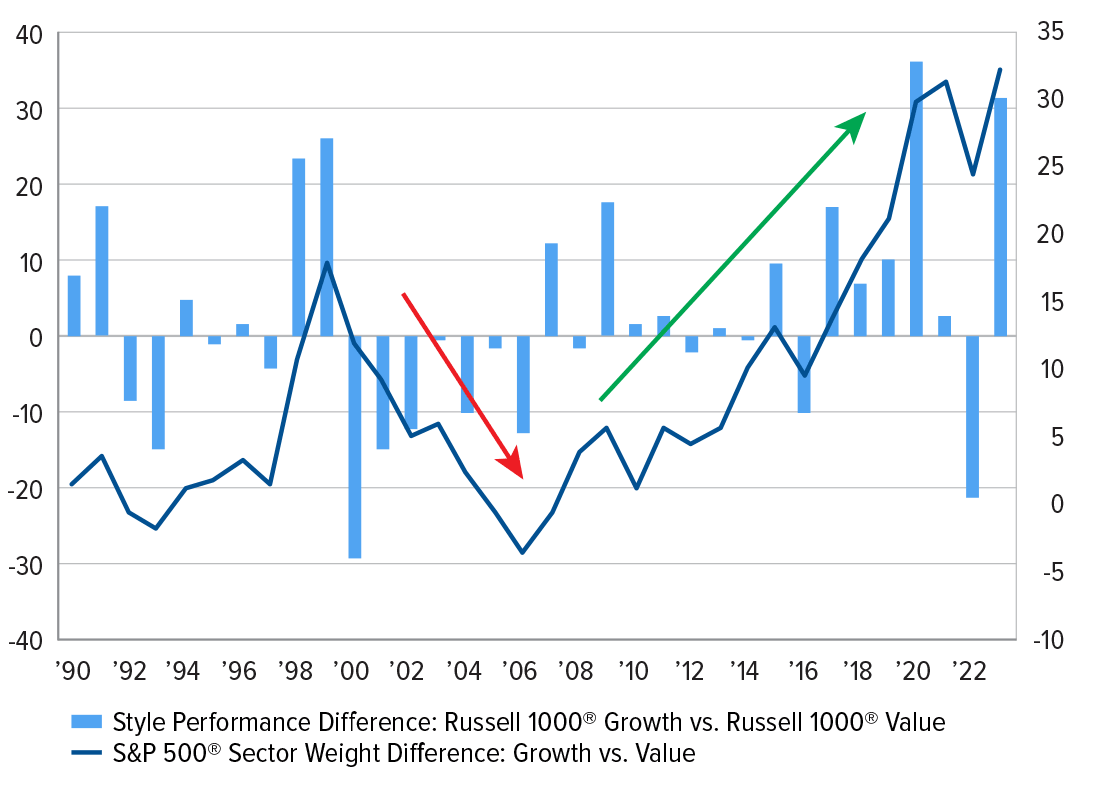
Macroeconomic regimes change over time, so sampling different periods may yield contrasting results. If one was to conduct a study between 1975 and 1990, one may conclude that value stocks tend to outperform growth stocks over the long-term. It should be noted that for performance purposes, we used the S&P indices for the following chart, as they have a longer track record than the Russell indices.Chart 1: EME outperformed the S&P 500® index from 2001 to 2007


Chart 1

Chart 1

Source: FactSet


Value sectors tend to include very traditional and established industries. These include financials, energy, and real estate, which may do well when the economy bounces back and is humming along. In such environments, inflation and interest rates rise at a healthy pace. For instance, traditional banks benefit from a positively sloped yield curve, where they lend at higher rates and borrow at lower rates. Energy and real-estate sectors tend to benefit when commodity prices steadily rise, which in turn increases their value. To simplify things, value companies should perform well when interest rates are steadily rising and positively sloped. It should be noted that between 1975 and 1990, the 10-year Treasury yield and the Consumer Price Index (CPI) averaged nearly 10% and over 6%, respectively.

Also note that governments sometimes adopt deregulation policies for major industries (for both economic and political purposes). That said, some key “value” sectors have benefitted from the relaxation of policies that were prominent between the 1970’s and 1980’s. For instance, the Depository Institutions Deregulation and Monetary Control Act of 1980 repealed some parts of the Glass-Steagall Act, which removed some key barriers for financial institutions. Then, around the end of the dotcom bubble, the Gramm-Leach-Bliley Act (aka the Financial Services Modernization Act of 1999) was enacted November 12, 1999, which further repealed part of the Glass-Steagall Act of 1933, removing more barriers for financial institutions.

Here is how the financial industry performed relative to the S&P 500® Index between 2000 and 2006.


Chart 2

Chart 2: EME underperformed the 500 index from 2011 to 2023

Source: FactSet


Going back to the earlier point, choosing a long-term value strategy versus a growth strategy would yield different results depending on the start-to-end period. For instance, if an investor chose to invest in a long-hold strategy between value and growth starting in the year 2000, he or she would end up with similar outcomes by the end of 2023.


Chart 3

Chart 3

Source: FactSet


There also are times when value may underperform growth strategies. With respect to government policies, antitrust regulations can break up monopolistic companies that can hinder industries. The adoption of the Dodd-Frank Act held back financial institutions with stringent compliance rules and tighter limitations on capital deployment. Throughout this restrictive period on large financial institutions, growth companies were able to play catchup and surpass traditional-value industries.


Growth Environments

Growth companies are highly valued for their future earnings. In terms of discounted cash-flow modeling, the present value should be higher when future discount rates are lower. In other words, growth companies’ future earnings are worth more when interest rates are lower and/or falling. Since growth stocks are more valued for their future earnings compared to value companies, growth companies may be more sensitive to cost of capital or changes in interest rates over time.

While growth companies benefitted from falling rates, value investing has experienced a long stretch of turbulence. For instance, the 10-year Treasury yield remained well below 4% since the Great Financial Crisis (GFC) until 2022. The interest rate environment has been unfavorable for value stocks, while cheap access to capital has been a boon for growth companies over the past decade. That said, we should not have been surprised by the long-awaited rotation from growth to value stocks in 2022 when the Fed engaged in aggressive interest rate tightening—though that rotation was short lived.

Fundamentals also play a key role in determining the attractiveness between growth and value stocks. For example, a company’s competitive environment will play a critical role in the future business of many industries. This is where government intervention can serve as a key catalyst that affects industries and their future fundamentals. As mentioned earlier, deregulation can do wonders for the bottom line to those taking advantage of the lax rules.

It should not be surprising that handcuffed financial industries (or value stocks) struggled, while certain technology companies (e.g., Magnificent Seven) have been able to dominate their respective markets. With the rapid rise of social media and other technological progress, lawmakers often struggle to keep up with changing times. While anticompetitive cases have been made against these new industrial leaders, we have yet to see anything materially unravel their business models.

Technological innovations can change industries and their growth projections. We saw one technological revolution in the early 1990s with the wide adoption of personal computers and the formation of the Internet. If we think back to sample testing, excluding these key growth periods would neglect key factors that influence investment behavior.

More recently, the excitement over artificial intelligence (AI) has rewarded certain companies with extraordinarily high valuations for their future growth potential. At the same time, we should recognize that overly excited investors and markets can be highly fickle. While “value traps” can attract bargain hunters to their slow demise, “growth traps” can quickly evaporate capital that has been blindly entrusted to intangible assets and unrealized future earnings when tides turn.


ETFs—Another Key Renovation

The meteoric rise in ETFs vs. mutual funds over the past two decades led to the significant amount of assets dedicated to ETFs, essentially making this instrument to become the “market.” It is not by coincidence that active managers have underperformed passive strategies since the trend toward the latter gained traction in the early 2000s.

Simply put, ETFs attempt to mirror a given benchmark by applying various replicating methods at low costs. There have been numerous studies on fund flows, but the findings have had mixed results. In general, flows can provide some insights into investor sentiment and help determine market trends.

First, we recognize that passive funds have garnered most of the fund flows since the GFC.


Chart 4

Chart 4

Source: © Copyright 2024 Morningstar, Inc.


This flow analysis would suggest that the constituents of the benchmark these passive strategies tracked would have seen flows respective to their weights within the benchmarks. On the other hand, constituents of active funds would have seen outflows over the past decade.


Chart 5

Chart 5

Source: © Copyright 2024 Morningstar, Inc.


The chart above clearly shows that large-blend funds have accumulated the greatest amount of assets over the past decade or so. In other words, most passive assets went to strategies that most likely tracked the S&P 500® Index, which is the most prominent benchmark for the U.S. market. This suggests that a vast amount of capital was chasing the same constituents of the S&P 500® Index, allowing the Magnificent Seven to grow to their current sizes. In short, the strong growth in ETFs contributed to the rise of mega tech companies.

The following chart compares out/underperformance of Russell 1000® Growth vs. Russell 1000® Value and growth/value sector weight differences of the S&P 500 Index.*


Chart 6

Chart 6

Source: © Copyright 2024 Morningstar, Inc.


As passive funds received considerable assets over the past decade (most of which were likely allocated to funds linked to the S&P 500® Index), more assets went to growth stocks as the S&P 500® Index consistently shifted to favor growth sectors. Coincidentally, this marked a period when the Russell 1000® Growth Index materially outperformed the Russell 1000® Value Index for most calendar years.

Therefore, rebalancing of the S&P 500® Index may also influence how growth and value stocks perform. The S&P 500® Index is a market-capitalization weighted index, encompassing the 500 leading publicly traded companies in the U.S. Given the focus on large companies, some top companies and industries within the S&P 500® Index may eventually become targets of regulators. U.S. regulators tend to implement federal laws to promote competition through antitrust policies, which tend to impair very large and powerful companies.

Post-GFC, large financial institutions have become more stabilized and better capitalized, although their potential earnings may have been suppressed without regulatory restrictions. While the low-interest-rate (and inverted-yield-curve) environment also had been adverse for the financial sector, conditions will eventually turn around, especially if regulators loosen their restraints.


Conclusion

Old-school investors have seen value investing work better because the macroeconomic and regulatory policies have been favorable toward value companies in certain periods. On the other hand, aggressive growth managers have been rewarded over the past 15 years because of the availability of cheap capital-funded growth companies without many regulatory constraints.

The purpose of this analysis is not to prioritize value investing over growth investing or vice versa. Instead, we want to point out the fundamental pitfalls in both styles. In low-interest-rate environments, many tech companies had the luxury to grow their businesses with cheap capital. This leverage allowed growth sectors to vastly outperform value ones, excluding in 2022 when the Fed implemented its aggressive rate hike program.

More recently, the further enhancement of AI and its adoption has created the “Magnificent Seven” frenzy. Not only did this lead to a surge of capital flooding into these mega tech companies, but it also has elevated their respective valuations. Nevertheless, overall valuations in the tech sector may still be below bubble territories. But above all, regulators have had difficulty handling the tech sector, most likely due to the complexity of technological innovation.

However, regulators will eventually catch up (and already may be catching up) with Big Tech. When that day comes, we may finally see a consistent rotation between growth and value. In the meantime, we at PLFA will closely monitor all the topics discussed in this article before making that call and adjust our portfolios accordingly.

From the ever-changing macroeconomic and geopolitical environment, we believe investment approaches will continue to evolve. Most of all, as asset allocators, we must constantly and actively evaluate these conditions to lean toward opportunities and circumnavigate obstacles.


* S&P 500® growth sectors include electronic technology, health technology, and technology services, while S&P 500® value sectors include energy, minerals, and finance.


For more insights from Pacific Life, visit PacificLife.com


This material is educational and intended for an audience with financial services knowledge.


Pacific Life Fund Advisors LLC (PLFA), a wholly owned subsidiary of Pacific Life Insurance Company, is the investment adviser to the Pacific Select Fund (PSF) which is available through certain Pacific Life variable annuities. PLFA directly manages certain PSF funds-of-funds.

This commentary represents the views of the portfolio managers as of 3/8/24 and are presented for informational purposes only. These views should not be construed as investment advice, an endorsement of any security, mutual fund, sector, or index, or to predict performance of any investment. Any forward-looking statements are not guaranteed. All material is compiled from sources believed to be reliable, but accuracy cannot be guaranteed. The opinions expressed herein are subject to change without notice as market and other conditions warrant. Sector names in this commentary are provided by PLFA and could be different if provided by a third party.

This material is provided for informational purposes only and should not be construed as investment, tax, or legal advice. Information is based on current laws, which are subject to change at any time. Clients should consult with their accounting or tax professionals for guidance regarding their specific financial situations.

Pacific Life refers to Pacific Life Insurance Company and its affiliates, including Pacific Life & Annuity Company. Pacific Life Insurance Company is the issuer in all states except New York. Pacific Life & Annuity Company is the issuer in New York.

The home office for Pacific Life & Annuity Company is located in Phoenix, Arizona. The home office for Pacific Life Insurance Company is located in Omaha, Nebraska.

Pacific Life, its distributors, and respective representatives do not provide tax, accounting, or legal advice. Any taxpayer should seek advice based on the taxpayer's particular circumstances from an independent tax advisor or attorney.

Pacific Life is a product provider. It is not a fiduciary and therefore does not give advice or make recommendations regarding insurance or investment products.

Unless otherwise noted, all aforementioned money managers, their distributors, and affiliates are unaffiliated with Pacific Life and Pacific Select Distributors, LLC.

Pacific Life refers to Pacific Life Insurance Company and its subsidiary Pacific Life & Annuity Company. Insurance products can be issued in all states, except New York, by Pacific Life Insurance Company or Pacific Life & Annuity Company. Product/material availability and features may vary by state. Each insurance company is solely responsible for the financial obligations accruing under the products it issues. 

Variable insurance products are distributed by Pacific Select Distributors, LLC (member FINRA & SIPC), a subsidiary of Pacific Life Insurance Company and an affiliate of Pacific Life & Annuity Company. 

The home office for Pacific Life & Annuity Company is located in Phoenix, Arizona. The home office for Pacific Life Insurance Company is located in Omaha, Nebraska.

No bank guarantee • Not a deposit • Not FDIC/NCUA insured • May lose value • Not insured by any federal government agency

For financial professional use only. Not for use with the public.

This website or its third-party tools use cookies, which are necessary to its functioning and are required to achieve the purposes illustrated in our online privacy policy.